
When have ice ages occurred?
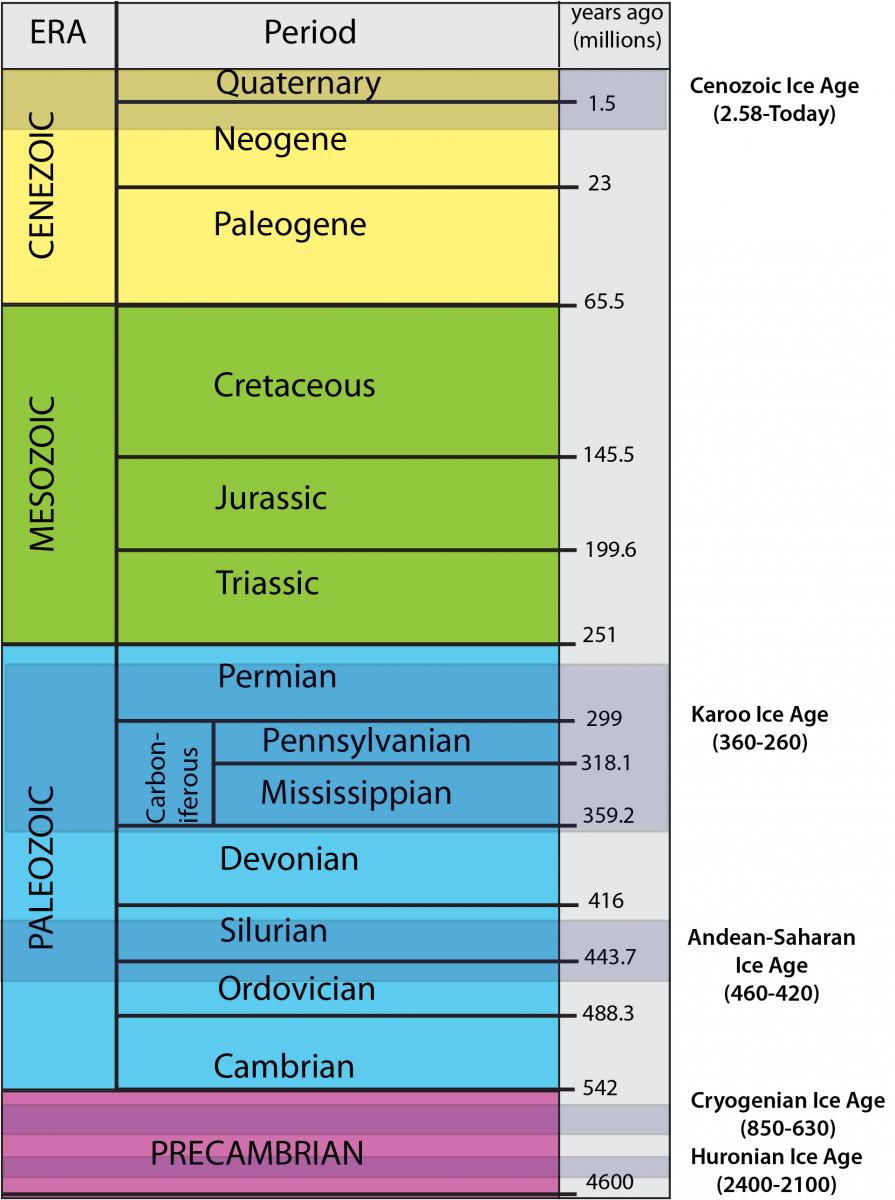 Many glacial advances and retreats have occurred over the course of Earth's history. These glaciations are not randomly distributed in time, but are concentrated into five intervals. Two very long and important intervals of glaciation occurred during the preCambrian, between about 2.4 and 2.1 billion years ago (the Huronian Ice Age) and again between about 850 and 630 million years ago (Cryogenian Ice Age). Glaciation was so extensive during these intervals that ice may have covered most, if not all, of the Earth's surface, producing a "Snowball", or at least a "Slushball", Earth. Somewhat less extensive glaciations occurred during portions of the Ordovician and Silurian (Andean-Saharan Ice Age, between about 460 and 420 million years ago), followed by a much longer and more extensive series of glaciations during the Karoo Ice Age in the Pennsylvanian and Permian (360-260 million years ago). Finally, the late Cenozoic, or Quaternary, Ice Age began roughly 2.58 million years ago, at the start of the Pliocene, and continues through today.
Quaternary Ice Age
Each long interval of glaciation is typically marked by many glacial advances and retreats, which correlate roughly with fluctuations in climate between colder (glacial) and slightly warmer (interglacial) conditions. Shorter-term oscillations in climate (<10,000 years) can also occur during these periods and are referred to as stadials (cooler) and interstadials (warmer). The Little Ice Age is a well-known stadial that occurred from roughly AD 1550 to 1850 and drastically affected the climate of the Northern Hemisphere.
During glacial periods, large quantities of water are locked up in ice, resulting in thick, heavy sheets of ice covering much of the continents in the higher latitudes and significantly lower sea levels worldwide. In North America, the Laurentide ice sheet covered most of Canada as well as the northern part of the United States from Maine to Montana and as far south as St. Louis and Cincinnatti during various parts of the Quaternary Ice Age. This massive ice sheet was roughly 2 miles thick at its core, and the volume of water locked up in the ice sheet was the equivalent of roughly 120 meters of global sea level. A second, smaller ice sheet called the Cordilleran Ice Sheet covered portions of western Canada and the U.S., stretching as far south as northern Oregon in the U.S. Throughout the Pleistocene and part of the Pliocene, these ice sheets advanced and retreated at variable rates, significantly altering the landscape. Geologists have used these landform changes to partially reconstruct the glacial history of North America. Although this reconstruction does not tell the whole story, it does provide a basic working framework within which to interpret the North American glacial-interglacial cycle in the mid-to-late Pleistocene.
| Episode | Time Span (years ago) |
|---|---|
| Hudson Interglacial | 10,000 - present |
| Wisconsin Glacial | 75,000 - 10,000 |
| Sangamon Interglacial | 125,000 - 75,000 |
| Illinois Glacial | 300,000 - 125,000 |
| Yarmouth Interglacial | 425,000 - 300,000 |
| pre-Illinois glacials and interglacials | >425,000 |
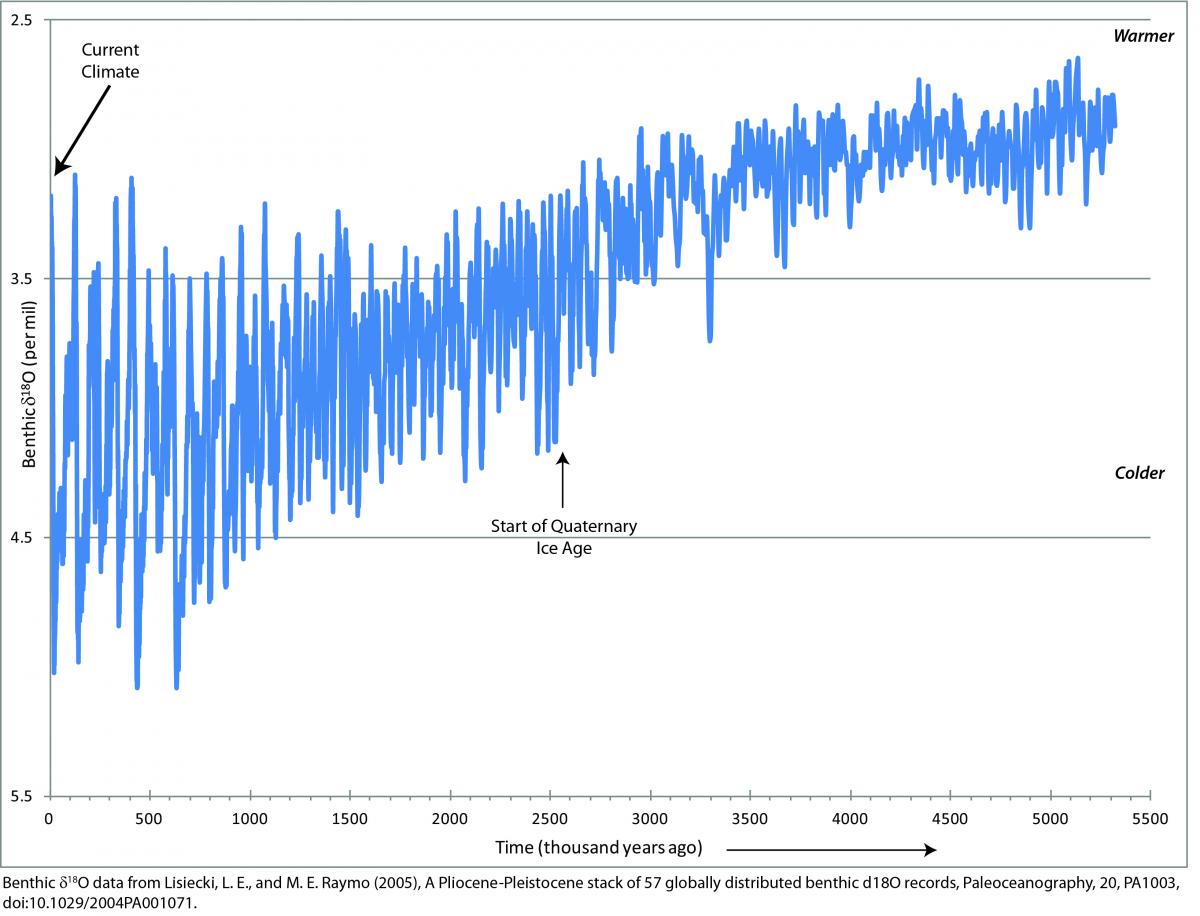
Recent work with ice cores from Greenland and Antarctica, as well as research on changes in marine isotopes, has revealed a more complex series of changes between warmer and colder global climatic conditions throughout the Quaternary. This research has focused on fluctuations in the ratio of heavy to light oxygen isotopes (oxygen isotope ratios) as a proxy indicator of ocean temperatures and ice volume. As climates cool, greater quantities of the light oxygen isotope, d16O, become concentrated in the snow precipitation that forms the continental ice sheets, resulting in ocean water that is enriched in the heavy oxygen isotope, d18O. When the climate warms and the ice sheets melt, light oxygen is returned to ocean water, reducing the ratio of heavy to light oxygen. Ice cores recovered from Antarctica provide an annual record of the oxygen isotope ratio in snow over the roughly past 800,000 years. This record has been correlated with a similar record obtained from ice cores in Greenland that covers the past 400,000 years and with less precise records from marine sediment cores that extend back over 5 million years. Together, this global data set has been used to identify more than 50 different cycles of higher and lower oxygen isotope ratios, which correlate with fluctuating ice volumes and related changes in global temperature.
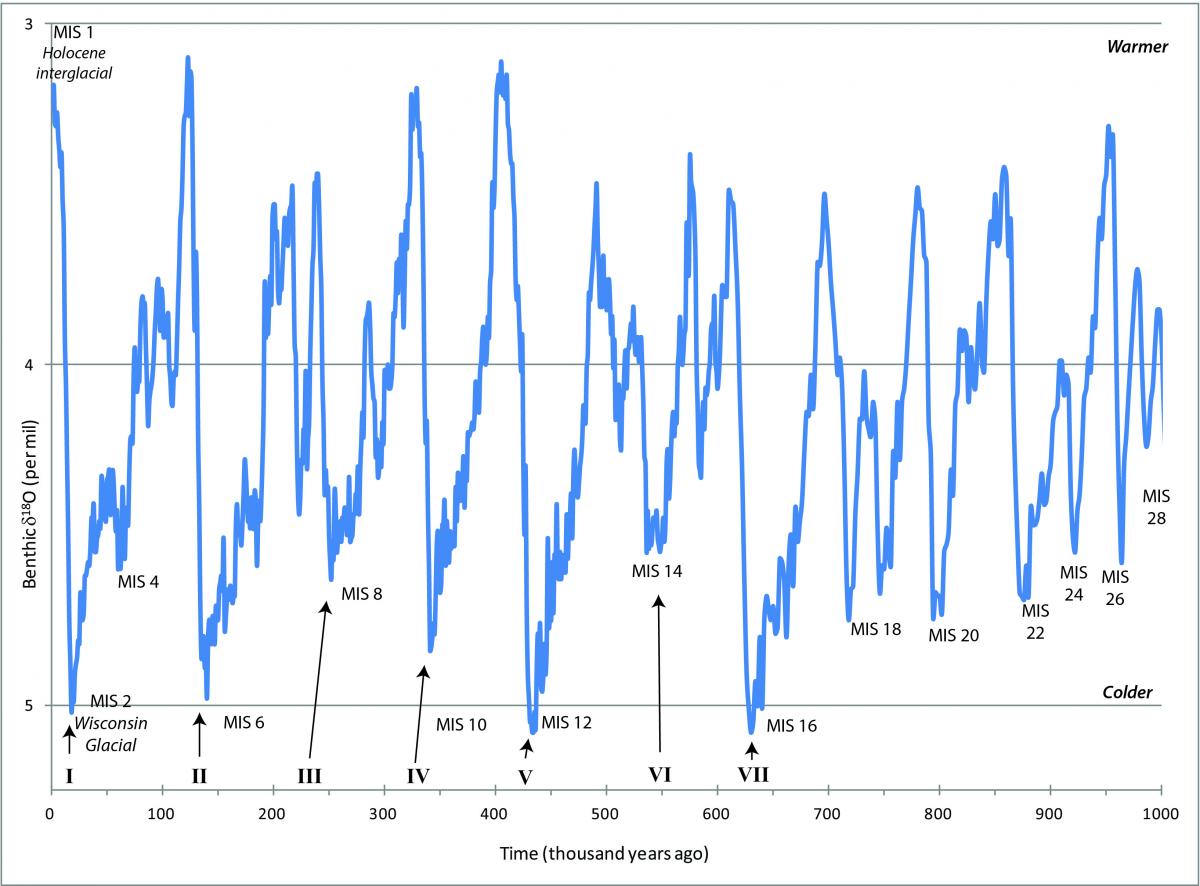 Because oxygen isotope data are used to establish these periods of warmer or colder temperature, the sequence is referred to as the Marine Isotope Stage (MIS) timescale, or alternatively as the Oxygen Isotope Stage (OIS) timescale. By convention, the warmer periods are assigned odd-numbered stages, starting with the Holocene (MIS 1), and the colder periods are assigned even-numbered stages, starting with the most recent glacial period (Wisconsin - MIS 2). The boundaries between cold and subsequent warm stages roughly correlate with glacial terminations, as delimited by an abrupt decrease in the oxygen isotope ratio indicating rapid ice sheet melting and deglaciation. Glacial terminations are indicated by Roman Numerals, starting with Termination I at the end of the most recent glaciation (Wisconsin period).
